4. Administration
This chapter assumes, that you have read chapter Basic Concepts.
In order to configure the Analysis Cockpit for the first use, the following steps need to be done:
License installation
System update
Set users and set user rights
Define canned responses
Decide about syslog forwarding
Integrate your log source
These steps are described in detail in the following sections.
4.1. License Installation
Before you can use the cockpit, you must install a license. Navigate to
the Licensing section, click the Upload License Button, select your
license file and click the Upload Button.
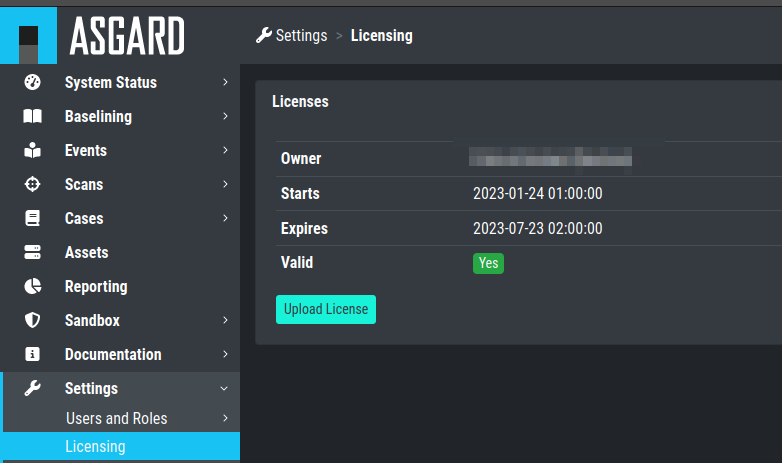
Licensing
4.2. System Update
All updates can be done from the Web GUI. Simply navigate to the Updates
section, review the release notes and click the update button. You can
also check for new updates by clicking the Check for Updates Button.
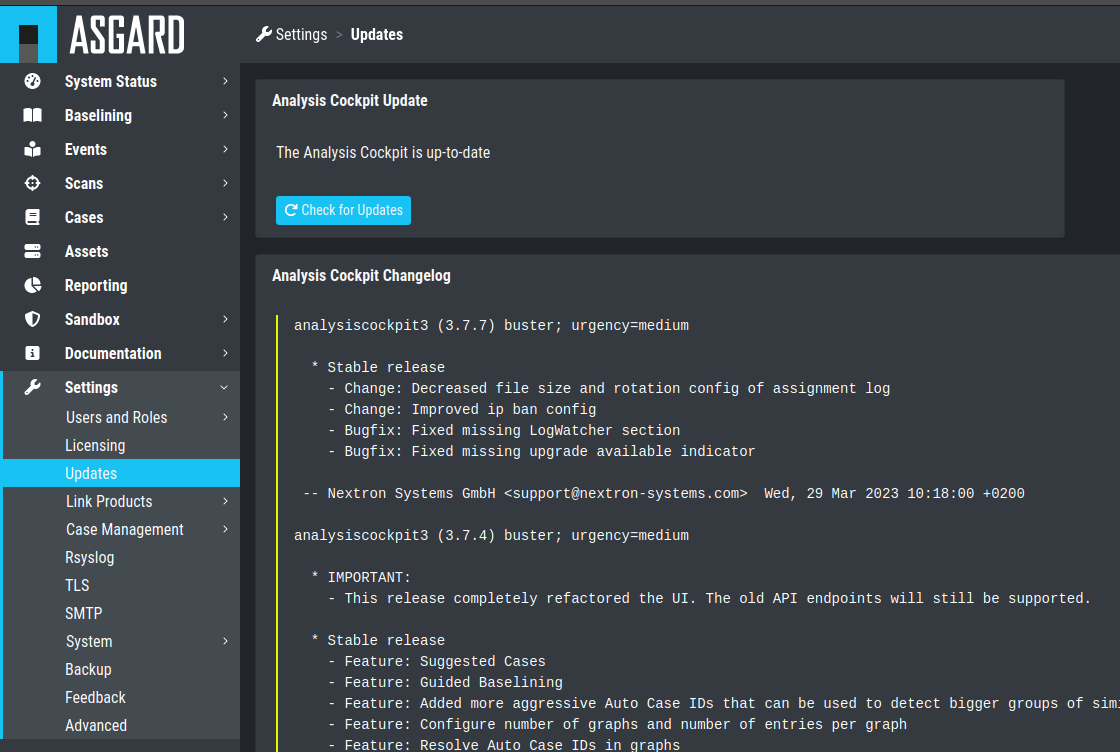
Updating the System
4.3. Set Users and User Rights
The chapter Understanding Users, Roles, Rights and Case Status already described how to set up a 2-level analyst model for working with cases. The roles defined in that section are non-administrative roles, meaning they are only allowed to access cases based on the respective status of a ticket.
Additionally, roles can have the following rights:
Administrator
Universal
View Notifications
Acknowledge Notifications
Upload Events
Delete Events
Upload File(s) for Sandbox Analysis
Download File(s) for Sandbox Analysis
Roles can be granted these privileges by choosing them in the New Role
dialogue.
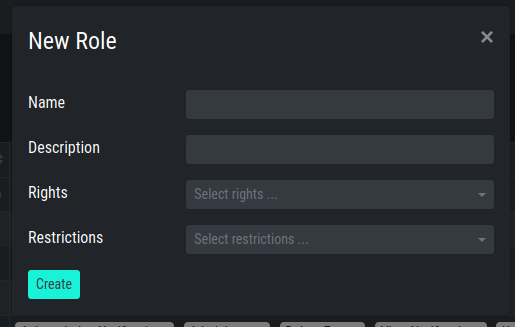
New Role
4.4. Configure Canned Recommendations
Canned recommendations are predefined actions that can be used within a
case. The recommendations are fully configurable and are aimed to
facilitate choice making regarding the action that should be applied for
a specific case. There is no need to set this up, but we suggest doing
some planning and provide recommendations that are suitable for your
organization. Some recommendations such as Verify Legitimacy, Provide
Sample File / Sample Directory, Run full Antivirus Scan are already
generated by default. You are free to use, modify or delete them.
Recommendations can also be added by any user from within a case.
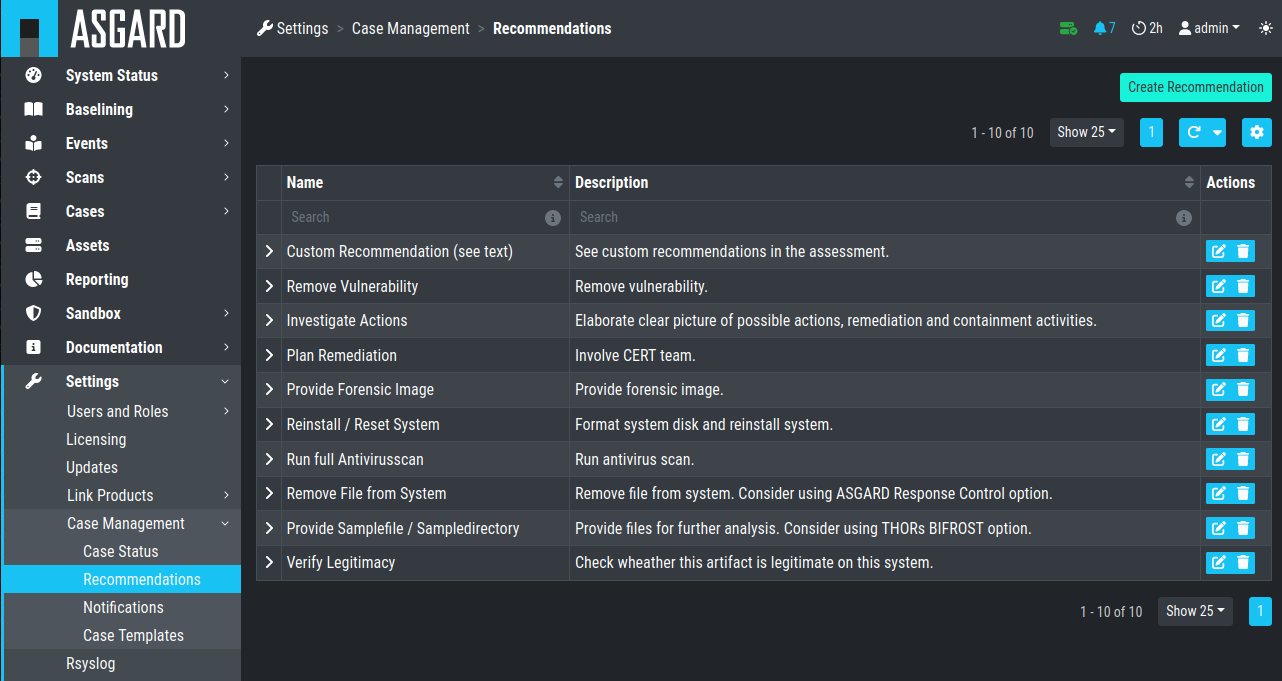
Case Management- Recommendations
4.5. Syslog Forwarding
The Rsyslog Tab in the Settings section allows forwarding of all incoming THOR events along with all audit logs and all other cockpit related logs.
Please note, that forwarding THOR Logs through syslog might lead to a certain loss of information as THOR events might exceed syslog length restrictions.
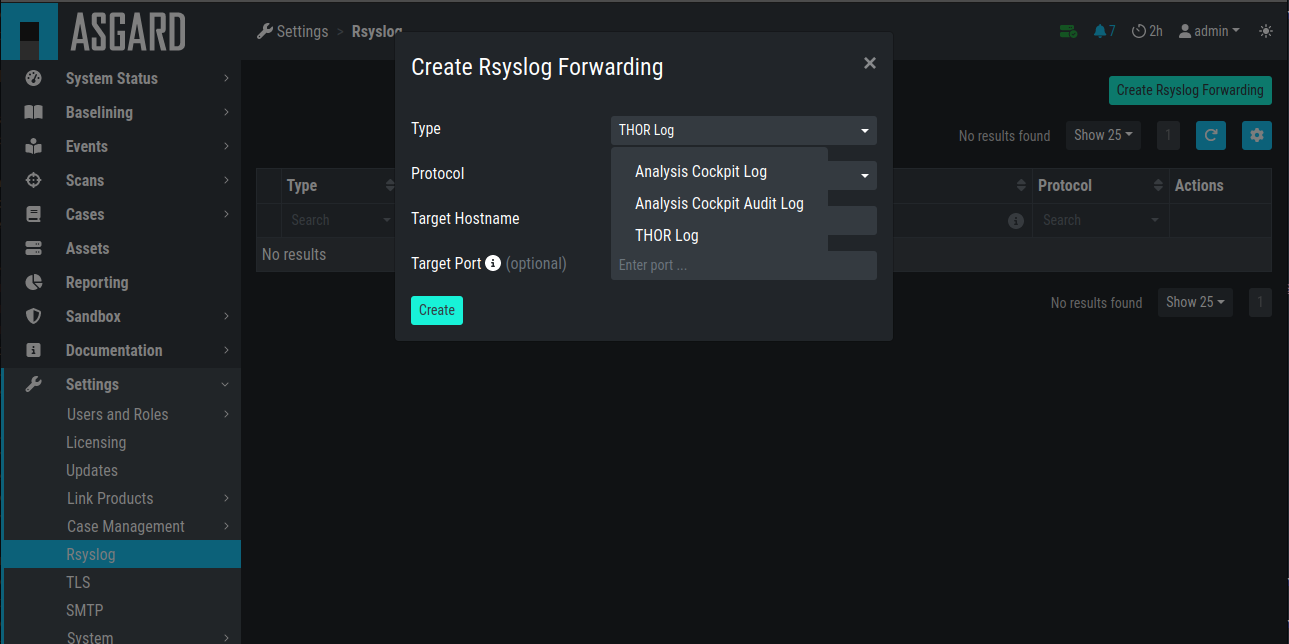
Add Rsyslog Forwarding II
4.6. TLS Certificate Installation
Instead of using the pre-installed self-signed TLS Certificate, users can upload their own TLS Certificate for ASGARD.
In order to achieve the best possible compatibility with the
most common browsers, we recommend using the system's FQDN
in both fields Common Name AND Hostnames.
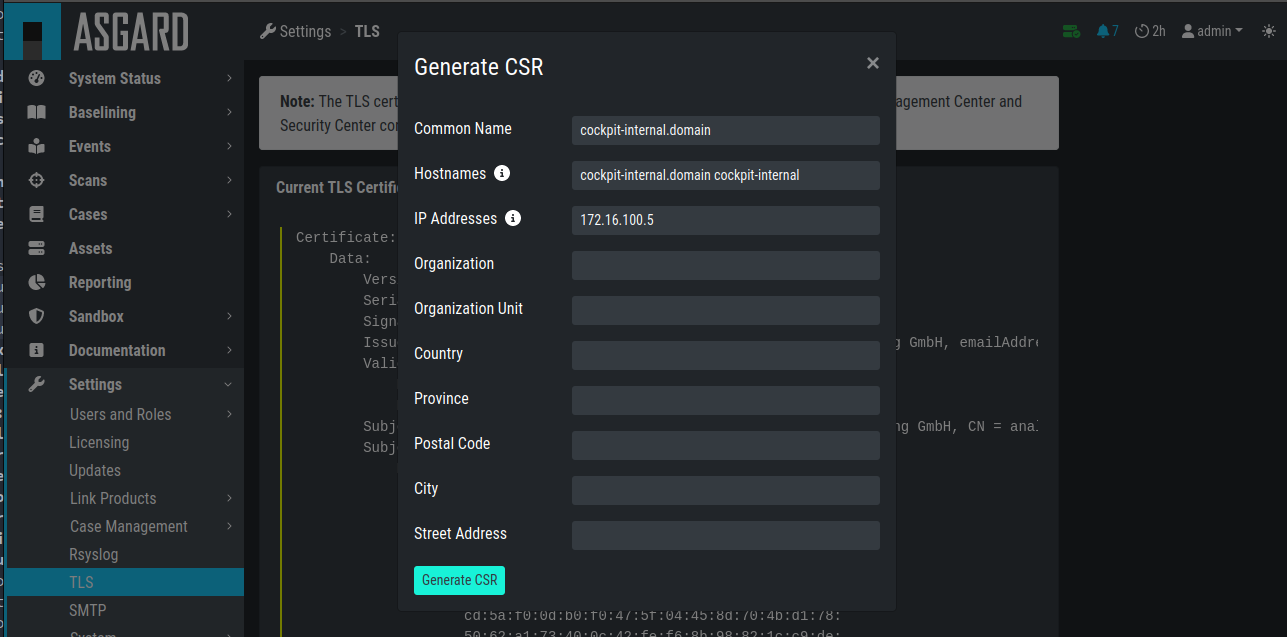
Generate a Certificate Signing Request (CSR)
Hint
Please note that generating a CSR on the command line is not supported.
The generated CSR can be used to generate a TLS Certificate.
Subsequently, this TLS Certificate can be uploaded in the Settings > TLS section.
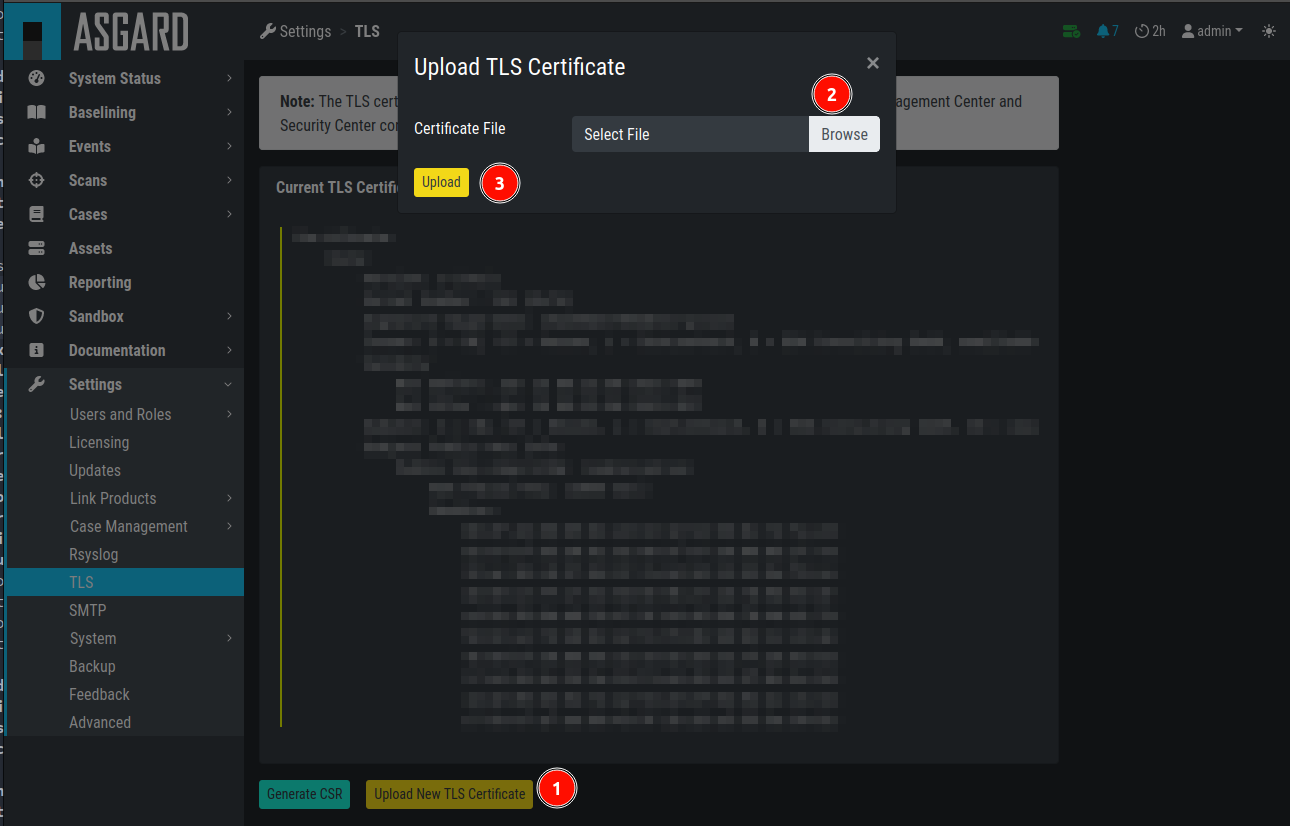
Upload a TLS Certificate
4.7. Configure LDAP
The LDAP tab in the Users and Roles section lets you configure an LDAP server
and define mappings for LDAP groups to roles within the Analysis
Cockpit.
The figures below illustrate options of a possible LDAP configuration.
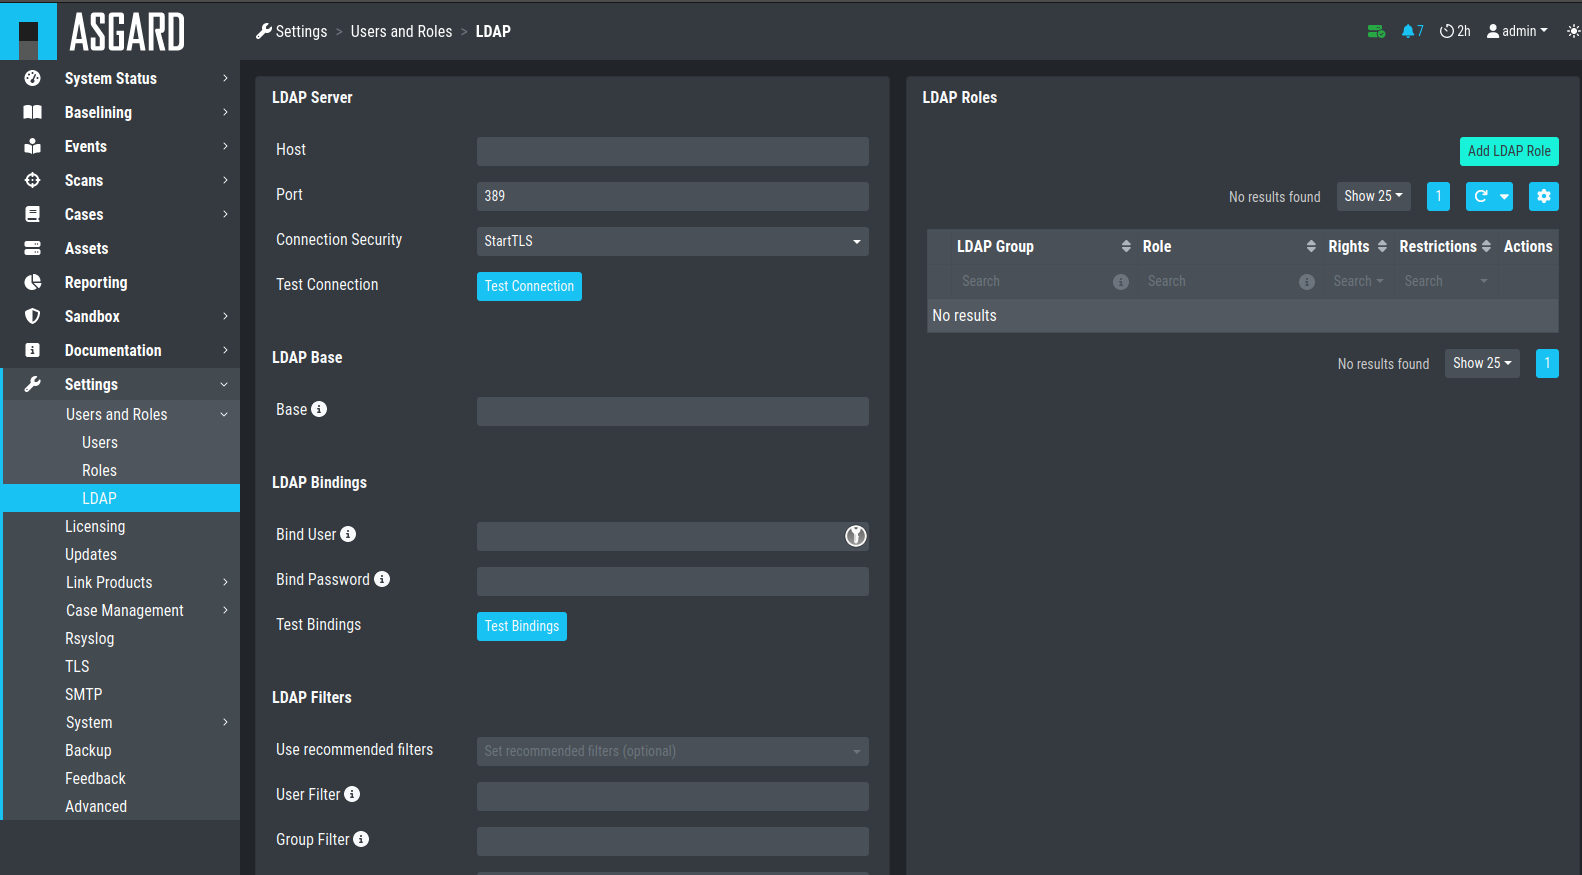
Configure LDAP
4.8. Configure Notifications
As described in Cases and Log Processing, the Analysis Cockpit is able to forward logs to a SIEM system in case this particular log line was added automatically to a case with the type "Incident".
The Notifications tab allows you to define custom notifications for
event assignments (Event Assignment Notifications). It is recommended to
at least configure an Event Assignment Notification for events that get
added to existing Incident cases.
Additionally, notifications can be defined for changes to cases (Case Change Notifications), so Level 2 analysts can get notified if a case gets added to their in-queue (e.g., Finished Level 1).
The notification itself can be a syslog message or an email. In order to
use email for notifications you have to setup an email account in the
Mail Account Tab. Additionally webhook support has been added to
facilitate interfacing to services like Slack.
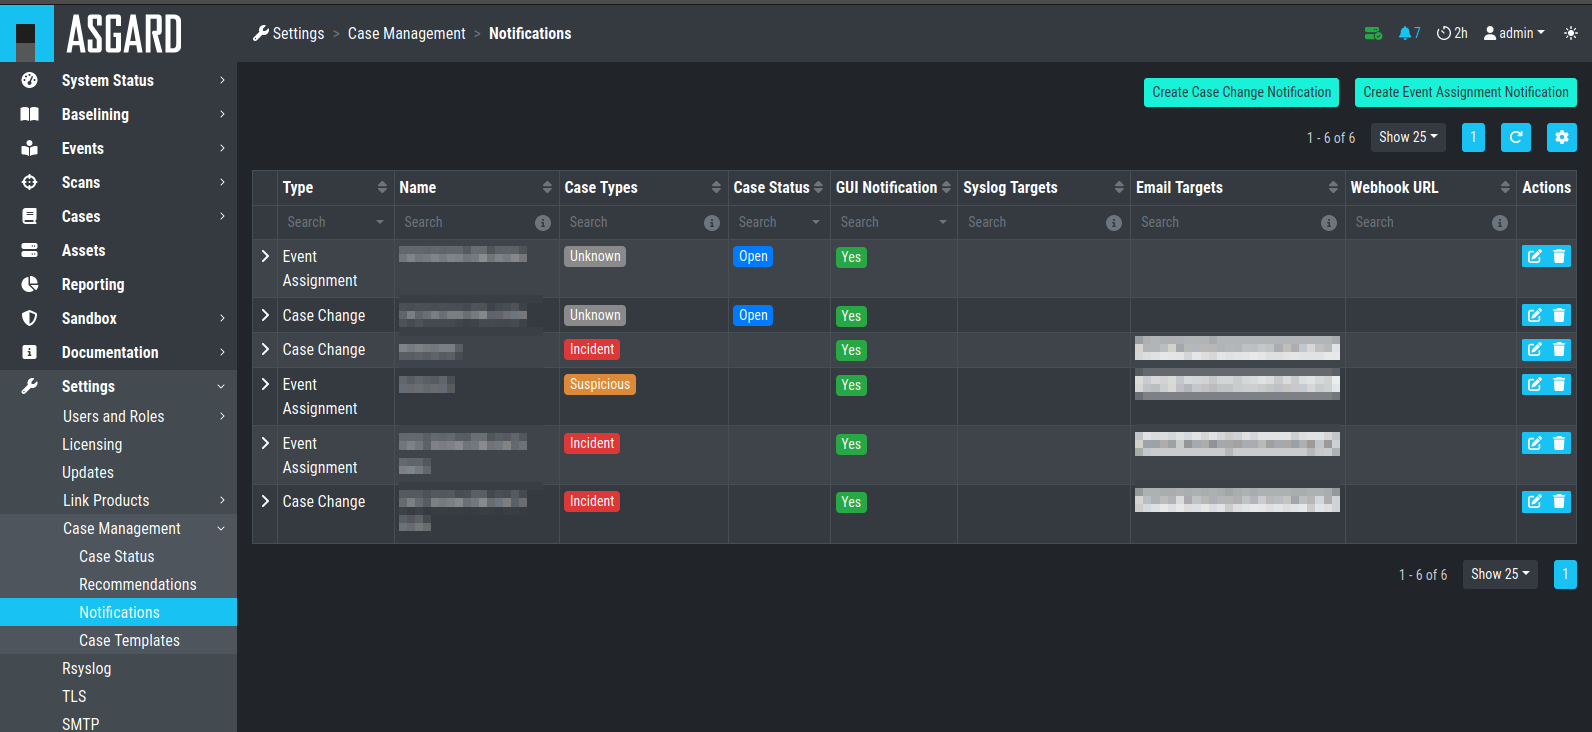
Case Management- Notifications
Note
The Analysis Cockpit will collect all triggering events and send only one email every 15 minutes. Syslog and Webhooks are triggered in real time for every single event.
Additionally, you can see the notifications in the top right corner (bell
icon) and inspect them. You will see all Unread notifications, which can
be Acknowledged by selecting one or more notification and clicking
Acknowledge. Only Unread notifications will show up in the top right
status bar of the Cockpit.
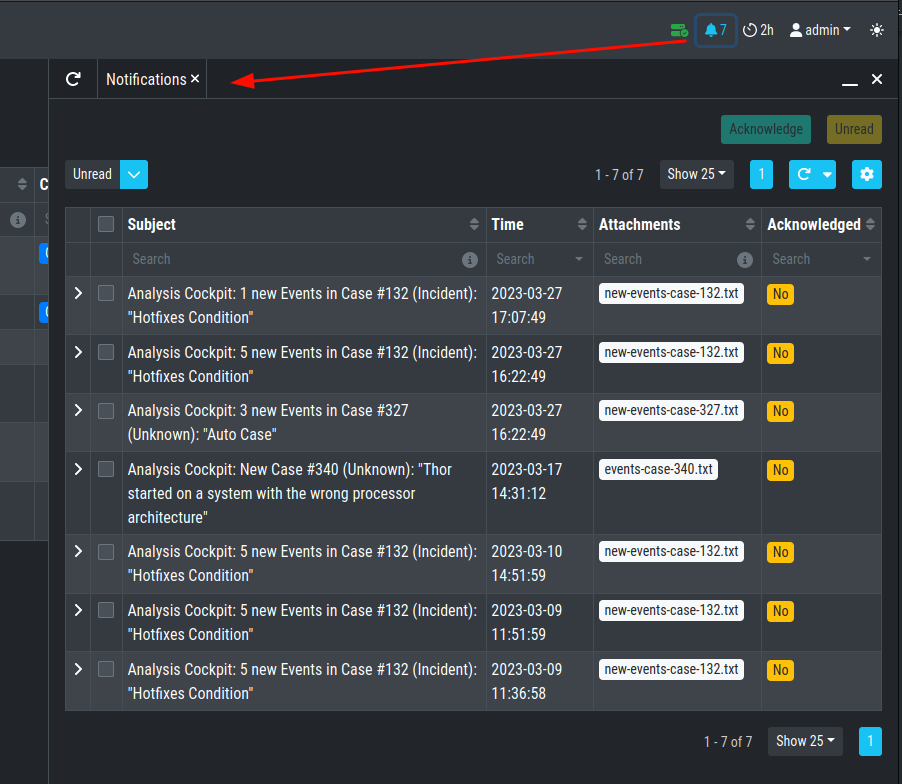
UI Notifications
4.8.1. Configure Event Assignment Notifications
To configure log notifications, click the
Add Event Assignment Notification button in the Notifications Tab of the
Settings section.
This leads you to a form that allows you to set a name for your
notification, the notification type (syslog, email, webhook or
notification within the Analysis Cockpit) and the condition that will
trigger your notification.
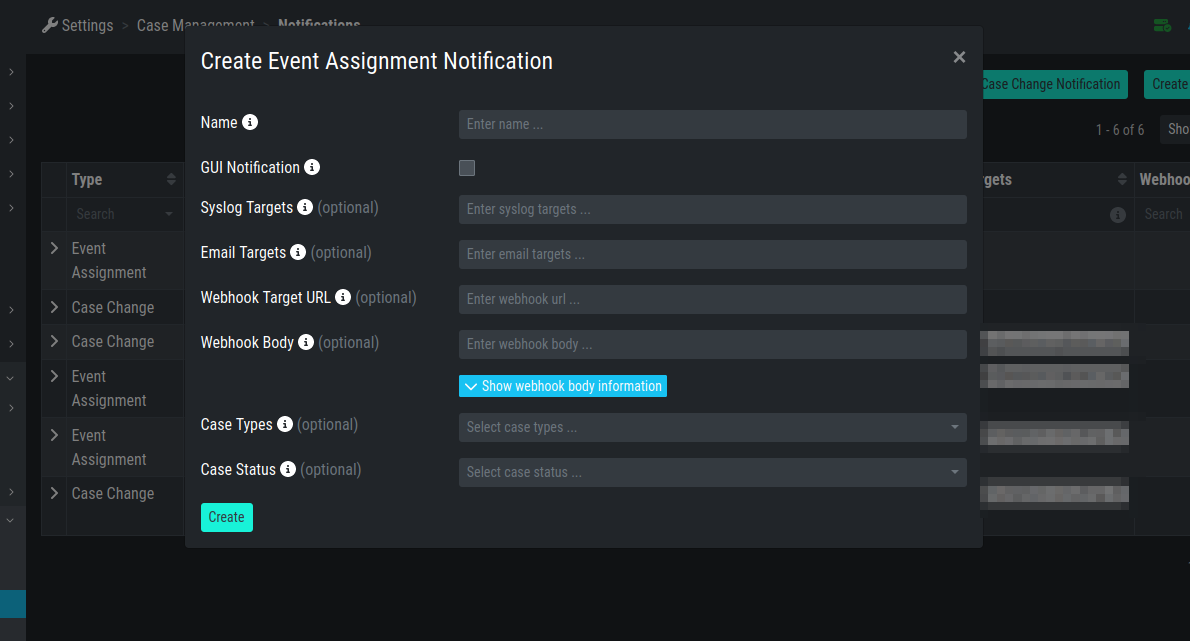
Event Assignment Notification
4.8.2. Configure Case Change Notifications
To configure Case Change Notifications, click the
Add Case Change Notification button in the Notifications Tab of the
Settings section.
This leads you to a form that allows setting a name for your
notification, the notification type (syslog, email, webhook or
notification within the Analysis Cockpit) and the condition that will
trigger your notification.
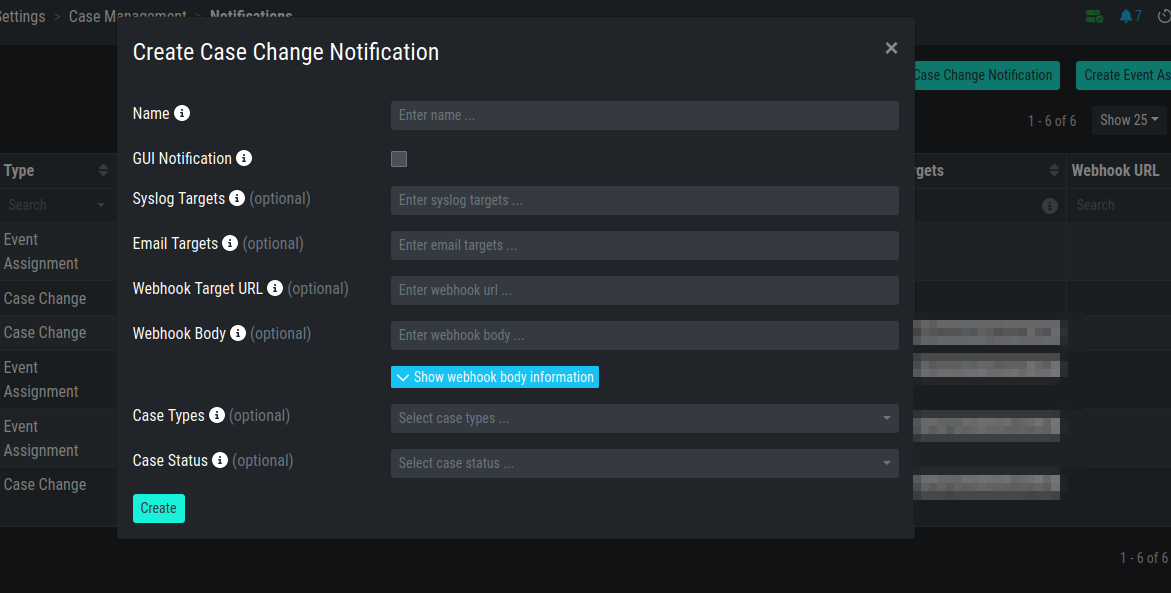
Case Change Notification
4.9. Log File Import
4.9.1. Basic Concepts
In general, all logs show up in the Events section. Additionally, all
Alerts and Warnings that are not matching a particular case will show up
in the Baselining section. Notices and informational events will NOT
show up in the Baselining Section as they match the predefined default
cases for these events.
All logs are tagged with a specific scan id – regardless of how the log was integrated. This enables filtering down to all logs contained in a specific scan.
If ASGARD Management Center is connected and the events was generated as part of a group scan the event is also tagged with this particular group scan id. This allows for filtering down to all logs a particular group scan.
Assets are identified through the asset ID that was issued by ASGARD Management Center during the setup of the ASGARD Agent. If this ID is not available to the Analysis Cockpit (e.g. log has been uploaded manually or sent through syslog) the hostname (NOT the FQDN) will be used instead.
4.9.2. Direct Integration with ASGARD Management Center
If the Analysis Cockpit is linked to one or more ASGARD Management Centers, all THOR logs get integrated automatically and will show up in the Baselining and/or the Events section. Aurora Events will also automatically show up.
To see how to connect an ASGARD Management Center with your Analysis Cockpit, follow the instructions in the chapter Connect to ASGARD Management Center.
You can retrieve old scans performed by ASGARD Management Center before
connecting it to Analysis Cockpit using the Request Events button in
the Scans section.
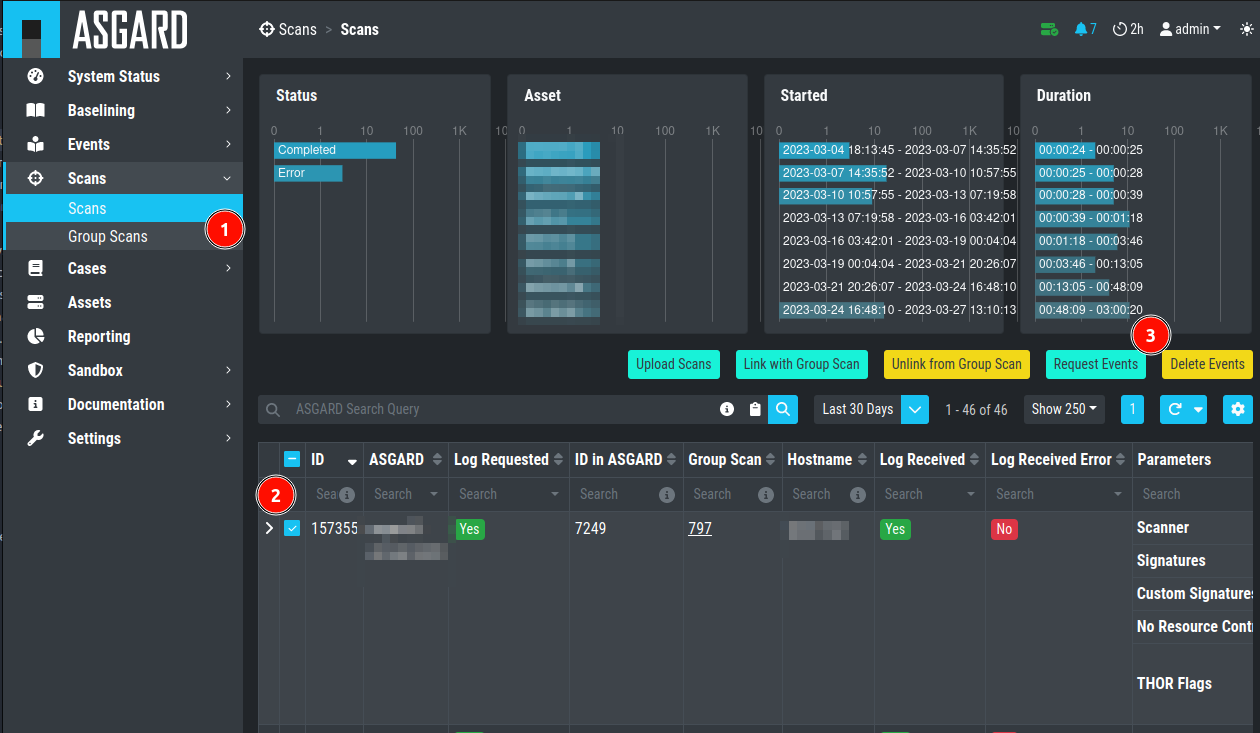
Request Events from Scan
4.9.3. Syslog Input
Another way to import log data is by using SYSLOG messages.
The ANALYSIS COCKPIT listens on port 514/udp and 514/tcp for incoming log data and all logs will show up in the Baselining and/or the Events section.
Incoming syslog messages get assigned to single scan using the "ScanID" value that's unique in each scan.
4.9.4. File Import Through Web-Based GUI
Alternatively, logs can be uploaded through the web-based interface by
selecting the particular log file (must be the .txt format, html import
is not supported) and clicking the Upload Scans button within the
Scans section.
Note
You can upload one or more THOR scans in one or more text files. The Analysis Cockpit will automatically generate scans in the database, based on the scanned assets and the SCAN_IDs in the events. Only .txt, .log, .txt.gz and .log.gz files are supported.
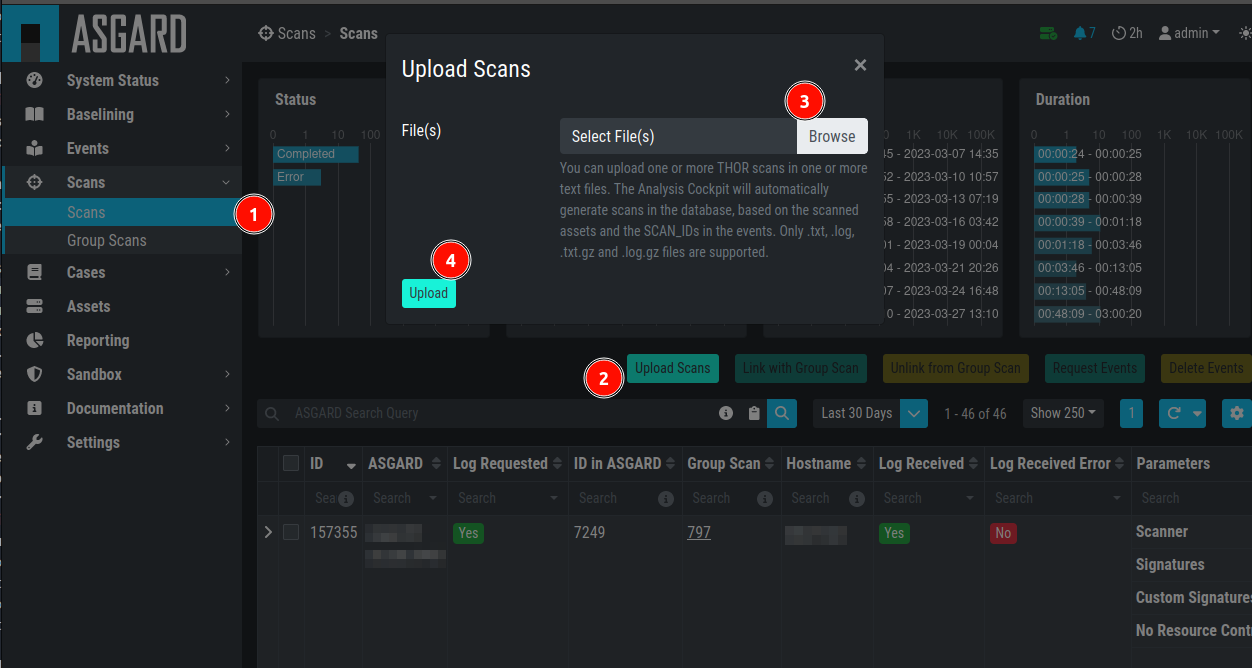
Upload logs using the web-based interface
After a successful upload, the scans should appear in the list below.
Important
If you can not see events in the Events or Baselining views,
please make sure that you've selected the correct time frame as filter.
Often times manually uploaded scans happened days or weeks before the
upload. The log data gets indexed with the timestamp of their creation
and not the import, and can therefore be hidden in the default view.
After the upload, you're able to link the recently uploaded scans with an existing or new group scan. You can also unlink scans from a group scan.
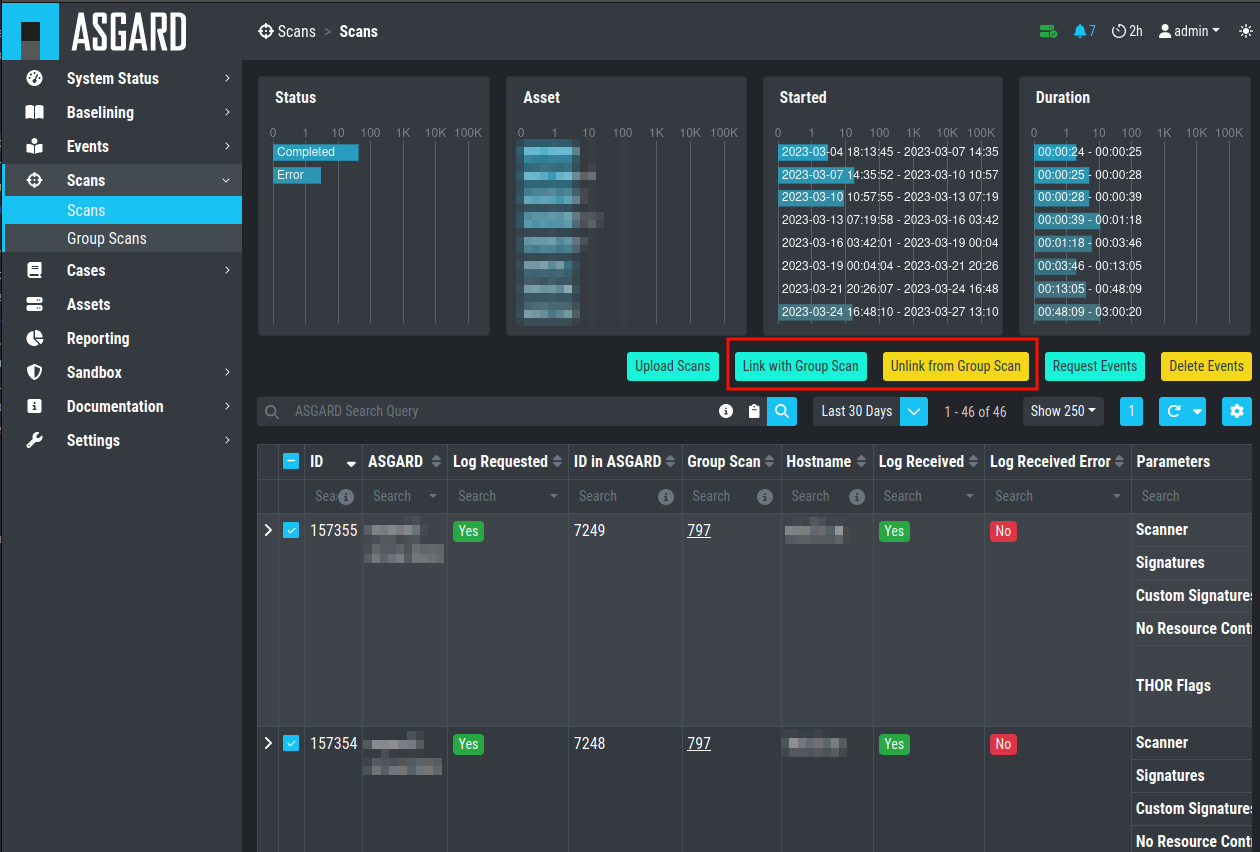
Link/Unlink scans with an existing or new group scan
4.9.5. File Import Using the Command Line
This option can be helpful in an environment where you scan without ASGARD Management Center but want to automate analysis by dropping the log data into that import directory.
Log files can be imported by placing the files in the following directory:
/var/lib/nextron/analysiscockpit3/events
Make sure that user and group of these files is set to cockpit.
You can change the owner and group manually by using:
nextron@asgard-ac:~$ sudo chown cockpit:cockpit <file>
Successfully imported files get a new extension named .ok.
When the file is moved to that folder with the wrong permissions, Analysis Cockpit tries to handle these situations in the appropriate way. If the Analysis cockpit had read access but no rights to write/delete/rotate/rename the file, the file gets blacklisted in memory and will not be imported as long as the service doesn't get restarted. A restart of the service would cause the service to re-index the log data placed in that folder.
Important
We highly recommend not to directly copy (scp, rsync) files into that folder, but use a staging folder in which you set the right permissions and then copy the files to the import folder.
Copying files directly to that folder has many problematic side effects, e.g. files partly composed of binary zeros because the file transfer is still in progress.
4.10. Connect to ASGARD Management Center
In order to receive log data from ASGARD Management Center systems, add them in the corresponding section in the system settings.
Settings > Link Products > Management Center
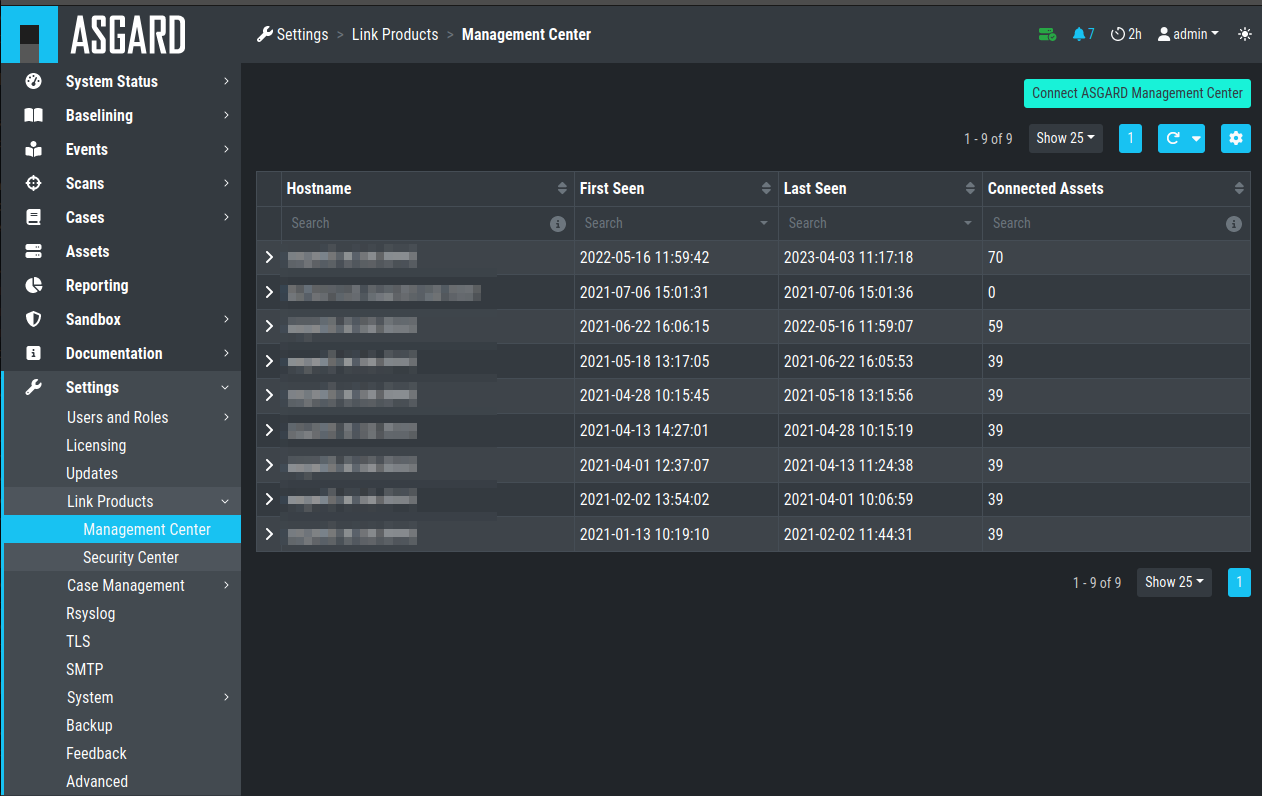
Link ASGARD Management Center
After you have connected the two components, all assets along with additional
information from ASGARD will show up in the Assets section of your Analysis
Cockpit.
Asset View after a Successful Connection
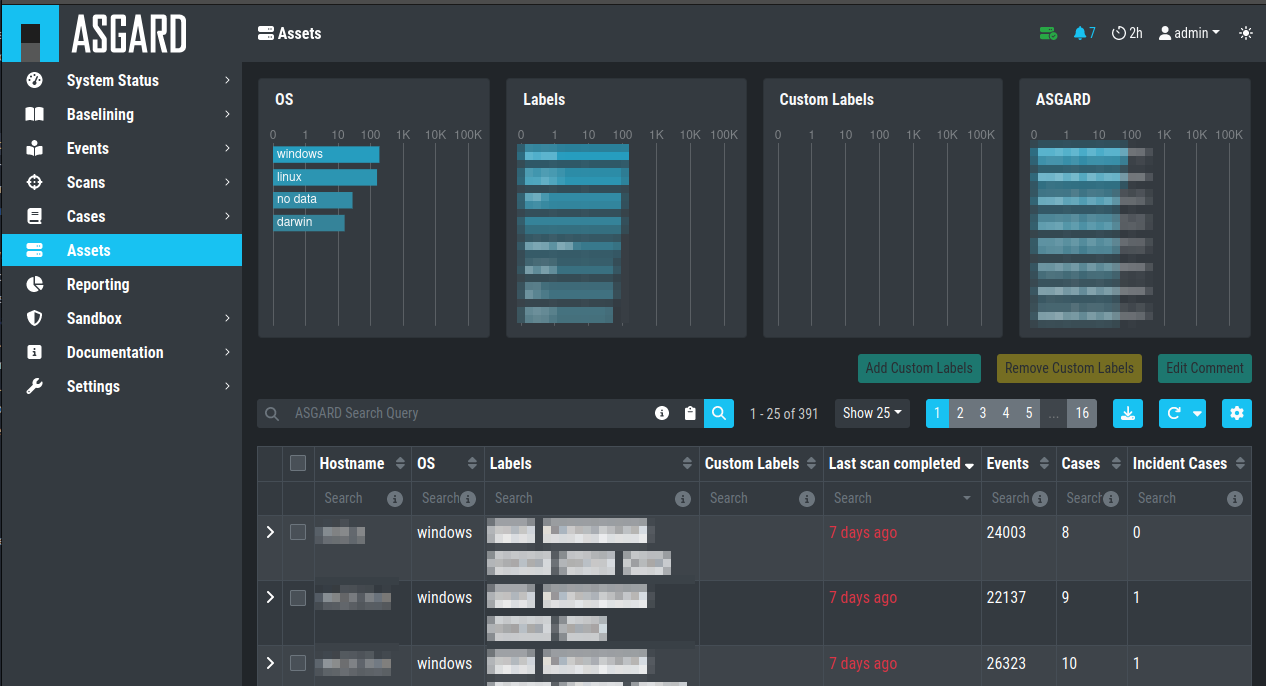
4.11. Asset View
In most cases working with the Baselining section and the Cases section
can be seen as the best practice approach for setting baselines and
dealing with alerts and warnings.
However, in some cases it makes sense to change perspective and rather go for a host centric approach. The Analysis Cockpit will calculate numbers of lines in different case types (Incident, Suspicious, Anomaly, etc.) on a per host basis for a given time frame. Along with information from ASGARD on last scan dates, labels, host availability etc. this gives an entirely different perspective.
By using the "Asset View" you can e.g., easily answer questions like:
Which systems appear most often in “Incident” cases?
Which systems haven't reported a single event for more than a month?
Which Domain Controllers have not been scanned yet?
Which systems with IP addresses starting "192.168." appear in "Incident" cases?
In combination with the ASGARD Query and Labels, which are identical
to your ASGARD, you can even narrow down the events by system group
(e.g., Domain Controllers, or certain locations).
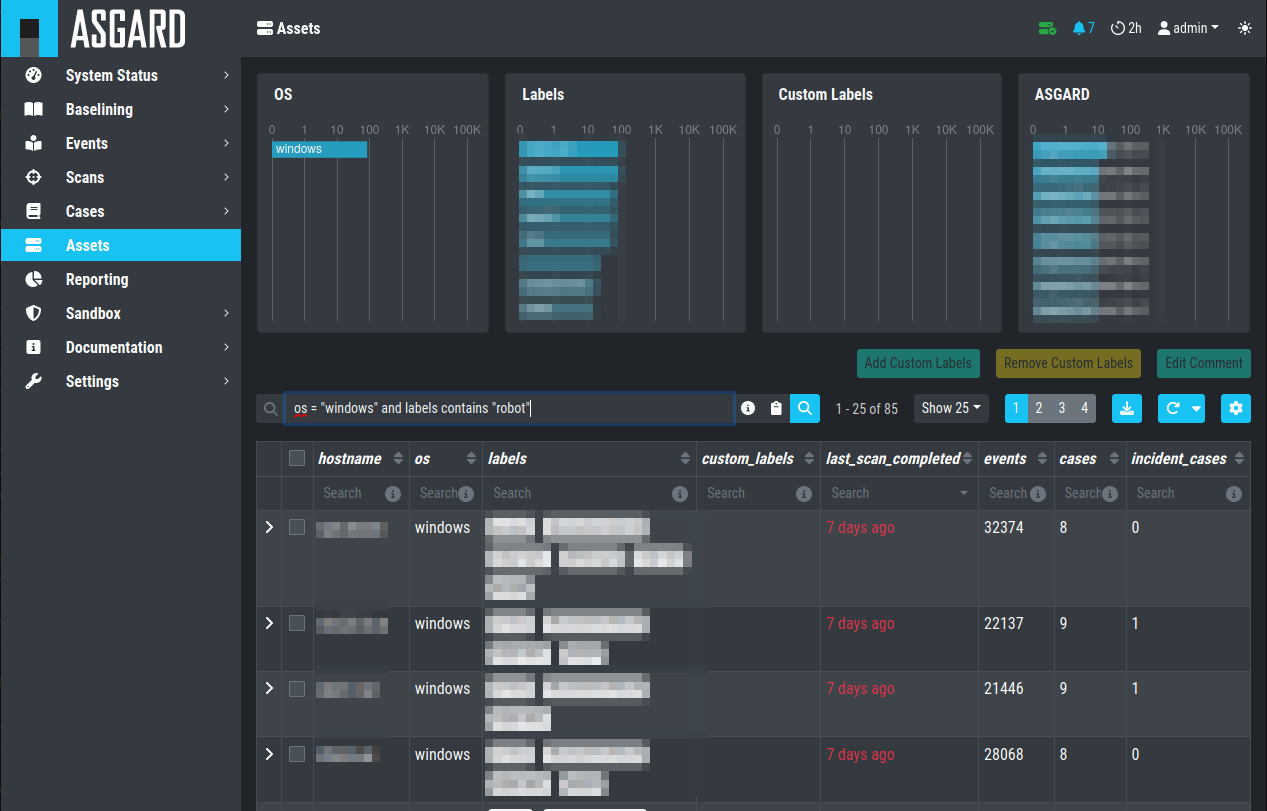
Filtering within the Assets view
4.12. Sandbox Integration
You can configure your Analysis Cockpit to upload files to a local sandbox. Currently you can use CAPEv2 (recommended) or Cuckoo.
Additionally, you can look at the following python file and write
your own connector, for a different sandbox, if you need to:
/etc/nextron/analysiscockpit3/sandbox/connector/capev2.py
Note
This section only focuses on the integration of your Analysis Cockpit with an existing sandbox. We will not cover how to set up the sandbox.
4.12.1. Analysis Cockpit Sandbox Configuration
In the web view of your Analysis Cockpit, navigate to Sandbox > Sandboxes.
Click Add Sandbox in the top right corner. Keep the Name short and add a
proper Description.
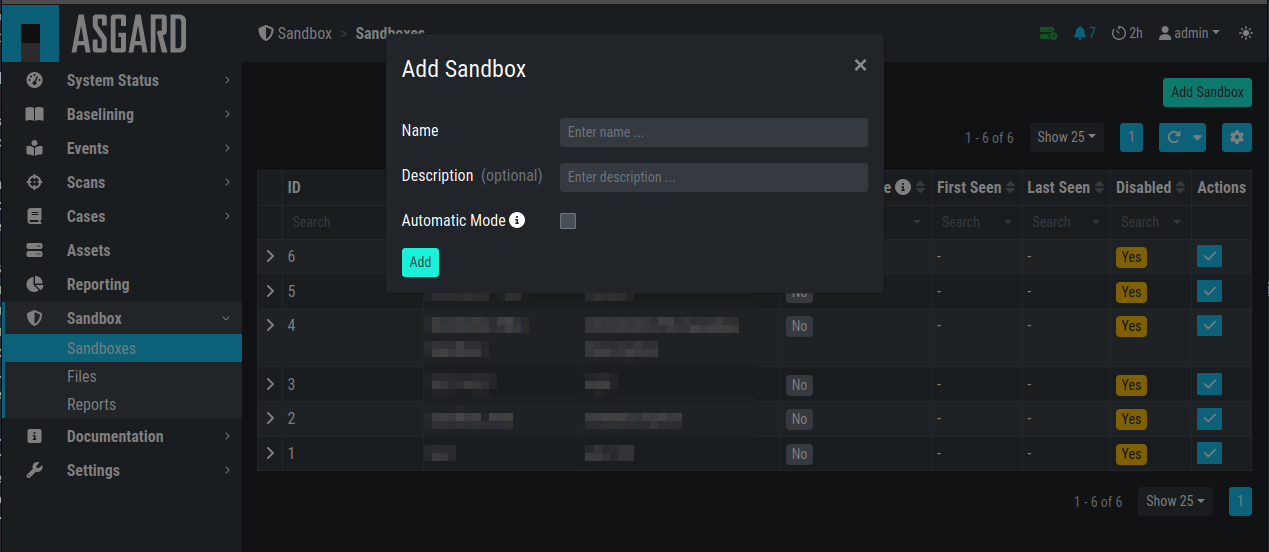
Adding a new Sandbox
Once you click Add the page will display an API token. Copy this token, we will need it later.
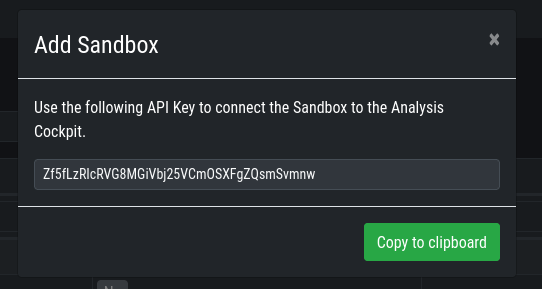
Sandbox API Token
Connect to your Analysis Cockpit via SSH and follow the steps below.
Change the user to the root user:
nextron@cockpit:~$ sudo su -
[sudo] password for nextron:
root@cockpit:~#
We change into the configuration directory of the sandbox:
root@cockpit:~# cd /etc/nextron/analysiscockpit3/sandbox/connector
root@cockpit:/etc/nextron/analysiscockpit3/sandbox/connector#
Here you can find multiple files and folders. The .py and .ini
files represent each the type of sandbox you want to integrate. In
this example, we will configure the CAPv2 sandbox with our Analysis Cockpit.
root@cockpit:/etc/nextron/analysiscockpit3/sandbox/connector# ls -lA
total 36
drwxr-xr-x 2 analysiscockpit3 analysiscockpit3 4096 Apr 21 15:27 analysiscockpit
-rw-r--r-- 1 analysiscockpit3 analysiscockpit3  253 Mär  3 11:20 capev2.ini
-rw-r--r-- 1 analysiscockpit3 analysiscockpit3 4934 Mär  3 11:20 capev2.py
-rw-r--r-- 1 analysiscockpit3 analysiscockpit3  278 Mär 28  2021 cuckoo.ini
-rw-r--r-- 1 analysiscockpit3 analysiscockpit3 9867 Nov 17  2020 cuckoo.py
drwxr-xr-x 2 analysiscockpit3 analysiscockpit3 4096 Apr 14 15:29 sandboxapi
Here we have two files which are of relevance for us:
capev2.ini
This holds the configuration for both the sandbox and your Analysis Cockpit
capev2.py
This has the systemd configuration to create the actual service on the system (we don't change anything in here)
Change the capev2.ini with a text editor. The important lines, which need to
be changed accordingly to your environment, are marked:
root@cockpit:/etc/nextron/analysiscockpit3/sandbox/connector# nano capev2.ini
 1[DEFAULT]
 2debug = yes
 3tmp_directory = /var/lib/nextron/analysiscockpit3/sandbox/capev2
 4
 5[capev2]
 6protocol = http
 7host = 192.168.0.50
 8port = 8000
 9token = <your CAPEv2 API token here>
10verify = no
11all = yes
12html = yes
13
14[analysis-cockpit]
15host = localhost:443
16apikey = <your API Key here>
17verify = no
For lines 6-10, please fill the information accordingly. host is the IP/FQDN
of your sandbox. port is the listening port of the web interface of your sandbox.
token is the API token generated in the user management of your sandbox.
verify is for verification of the TLS certificate (if you don't use TLS or don't
want to verify the certificate, set this option to no).
For lines 16-17 you have to set the apikey of your Analysis Cockpit (see "Add
Sandbox" step in the beginning of this section) and verify, which can be set to
no; this will verify the TLS certificate.
Save your files after you made your changes.
Now you have to create a new directory and give the analysiscockpit3 user permission:
root@cockpit:/etc/nextron/analysiscockpit3/sandbox/connector# mkdir -p /var/lib/nextron/analysiscockpit3/sandbox/capev2
root@cockpit:/etc/nextron/analysiscockpit3/sandbox/connector# chown -R analysiscockpit3: /var/lib/nextron/analysiscockpit3
We need to create a systemd service file in order to run the CAPEv2 connector on your Analysis Cockpit. Below you can find a predefined service file which we will use:
 1[Unit]
 2Description=CAPEv2 Sandbox Connector
 3After=network.target
 4
 5[Service]
 6ExecStart=/usr/bin/python3 /etc/nextron/analysiscockpit3/sandbox/connector/capev2.py
 7Restart=on-failure
 8User=analysiscockpit3
 9Group=analysiscockpit3
10SyslogIdentifier=capev2_connector
11
12[Install]
13WantedBy=multi-user.target
Now we run the following command and paste the content from the output earlier into it:
root@cockpit:/etc/nextron/analysiscockpit3/sandbox/connector# nano /lib/systemd/system/capev2-connector.service
The file should now look like this:
root@cockpit:/etc/nextron/analysiscockpit3/sandbox/connector# cat /lib/systemd/system/capev2-connector.service
[Unit]
Description=CAPEv2 Sandbox Connector
After=network.target

[Service]
ExecStart=/usr/bin/python3 /etc/nextron/analysiscockpit3/sandbox/connector/capev2.py
Restart=on-failure
User=analysiscockpit3
Group=analysiscockpit3
SyslogIdentifier=capev2_connector

[Install]
WantedBy=multi-user.target

root@cockpit:/etc/nextron/analysiscockpit3/sandbox/connector#
Now that the systemd service file is created, we need to activate it. Run the following command:
root@cockpit:/etc/nextron/analysiscockpit3/sandbox/connector# systemctl daemon-reload && systemctl enable capev2-connector && systemctl start capev2-connector
Created symlink /etc/systemd/system/multi-user.target.wants/capev2-connector.service → /lib/systemd/system/capev2-connector.service.
root@cockpit:/etc/nextron/analysiscockpit3/sandbox/connector#
The connection to your sandbox should work now. You can see the capev2.log for debug output and troubleshooting:
root@cockpit:~# tail /var/lib/nextron/analysiscockpit3/sandbox/capev2/capev2.log
22-11-15 12:07:46 DEBUG: Starting new HTTPS connection (1): localhost:443
22-11-15 12:07:46 DEBUG: https://localhost:443 "GET /api/sandboxes/a/reports/pending?limit=10&offset=0 HTTP/1.1" 200 13
22-11-15 12:07:46 DEBUG: no pending references found
22-11-15 12:08:46 DEBUG: Starting new HTTP connection (1): 192.168.0.50:8000
22-11-15 12:08:46 DEBUG: http://192.168.0.50:8000 "GET /apiv2/cuckoo/status/ HTTP/1.1" 200 289
22-11-15 12:08:46 DEBUG: Starting new HTTPS connection (1): localhost:443
22-11-15 12:08:46 DEBUG: https://localhost:443 "GET /api/sandboxes/a/get-sha256s-without-report?limit=10 HTTP/1.1" 200 13
22-11-15 12:08:46 DEBUG: Starting new HTTPS connection (1): localhost:443
22-11-15 12:08:46 DEBUG: https://localhost:443 "GET /api/sandboxes/a/reports/pending?limit=10&offset=0 HTTP/1.1" 200 13
22-11-15 12:08:46 DEBUG: no pending references found
root@cockpit:~#
4.12.2. Analysis Cockpit Sandbox Usage
Once your sandbox is set up and running, you can see the status of it in the sandbox view (Last Seen):
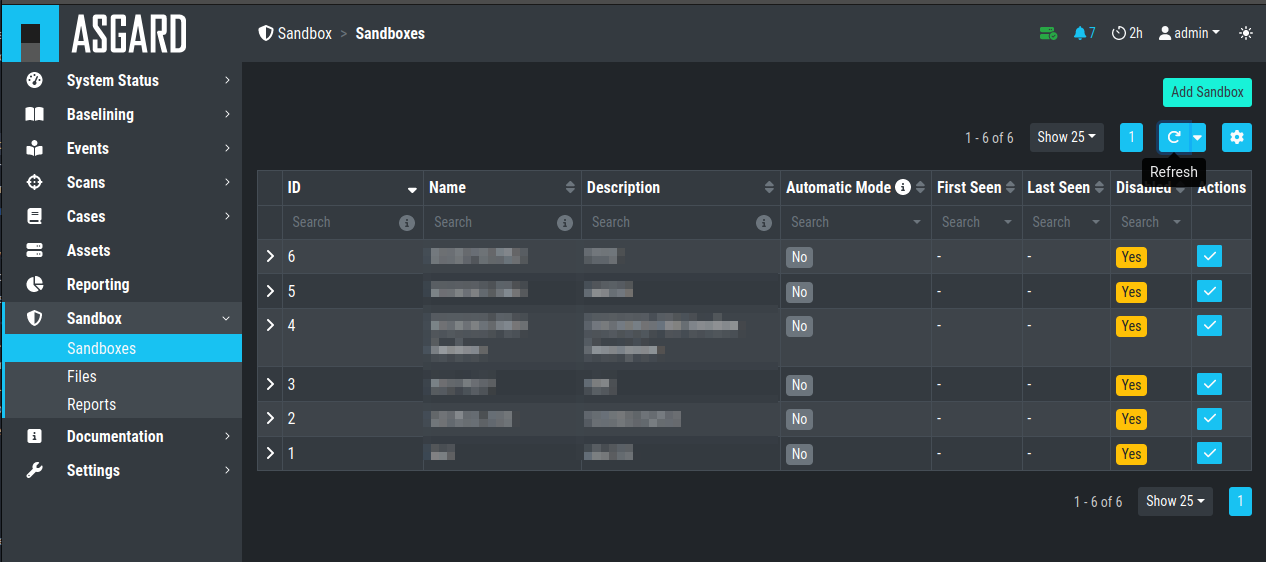
If you wish to enable automatic scanning for uploaded files (Bifrost), you can do so by pressing the play button to the right hand side.
In the Files view you can see previously analyzed files or upload files for analysis by yourself:
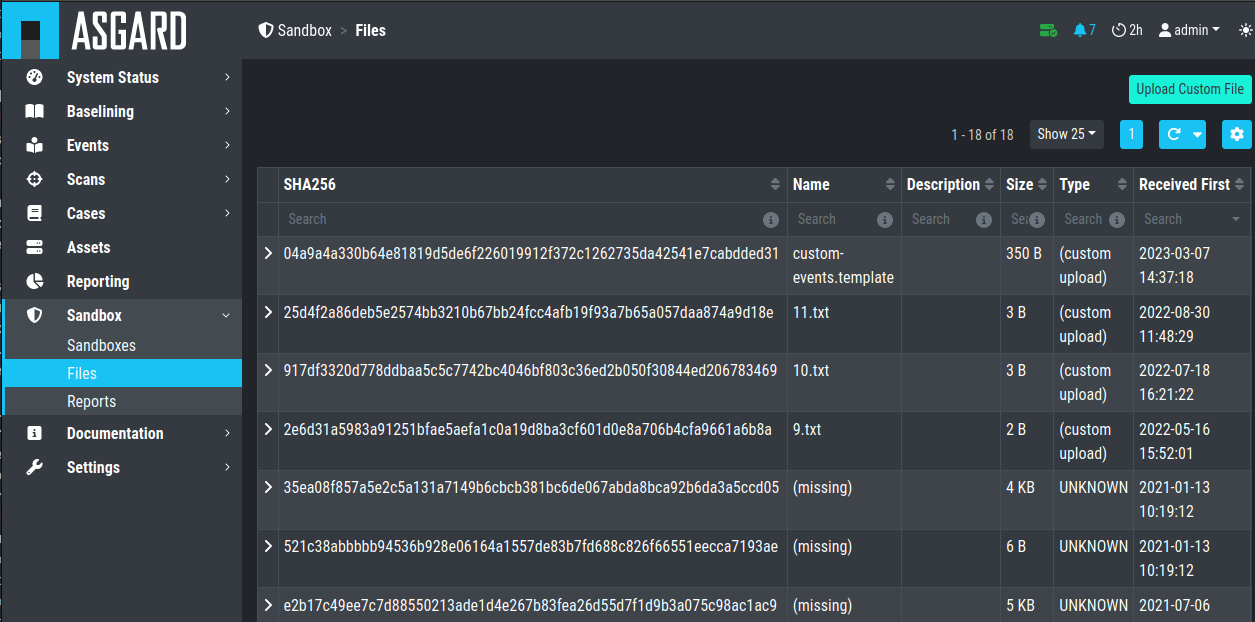
Note
If you did not enable auto mode of your configured sandbox, you have
to manually add the file for scanning in here. You can do this by pressing
the Scan file with sandbox button to the right of your file.
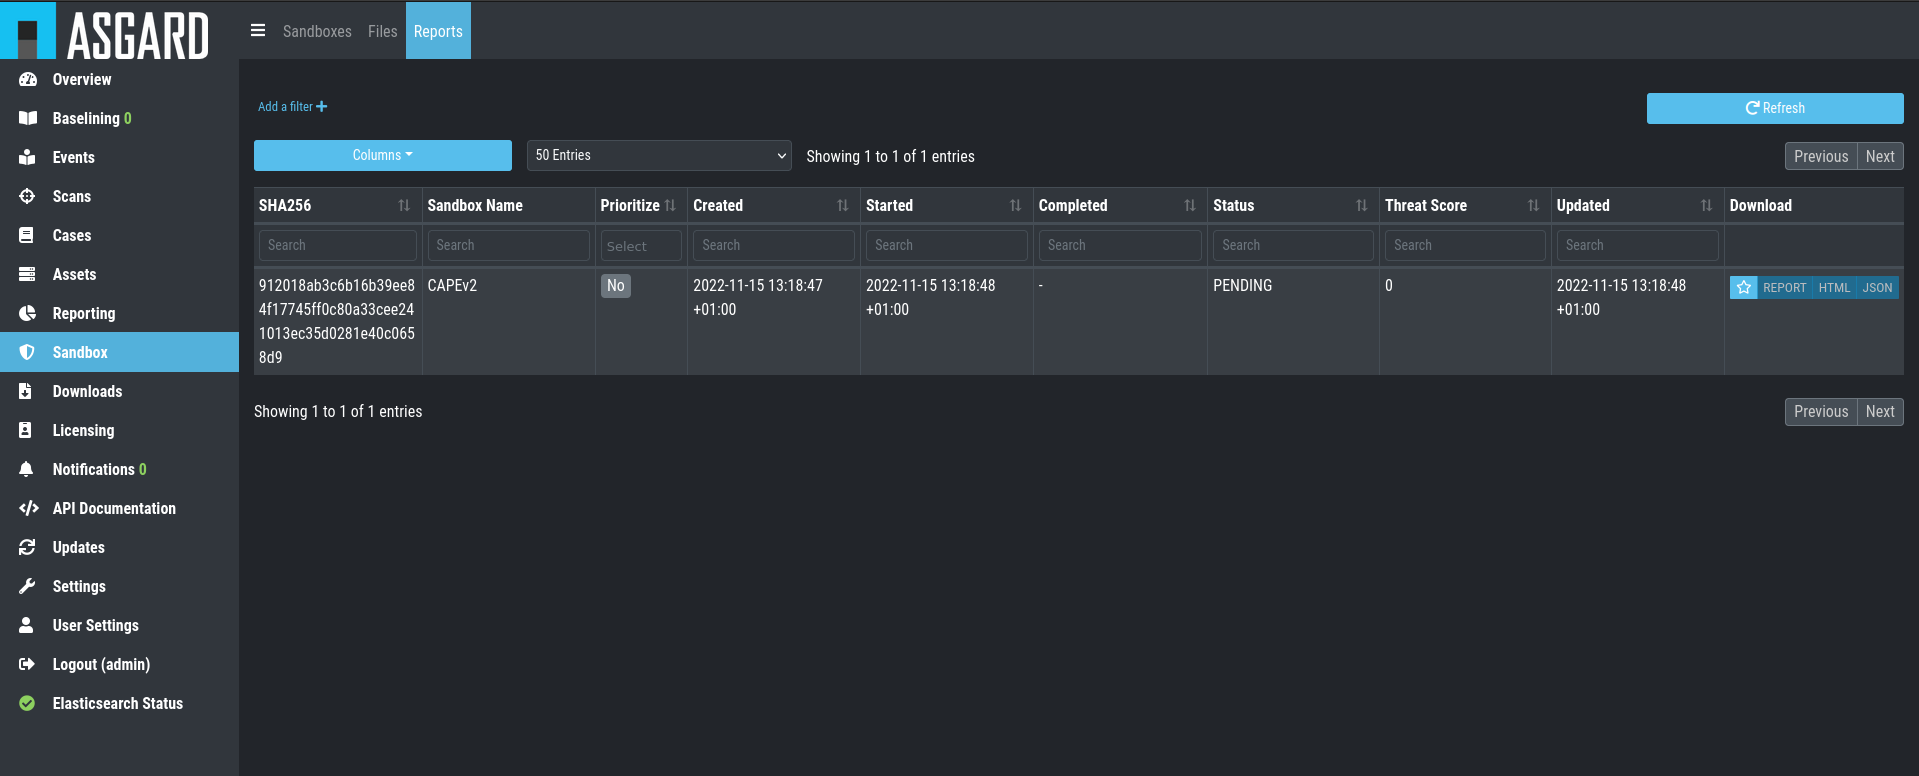
After your file has been uploaded, you have to wait until your sandbox
is finished with analyzing the file. Change to the Reports view
to see the status of the files.
Once the file was analyzed and the reports are ready, you will see that
the status of the file changed to SUCCESS and the buttons REPORT,
JSON and HTML can be clicked.
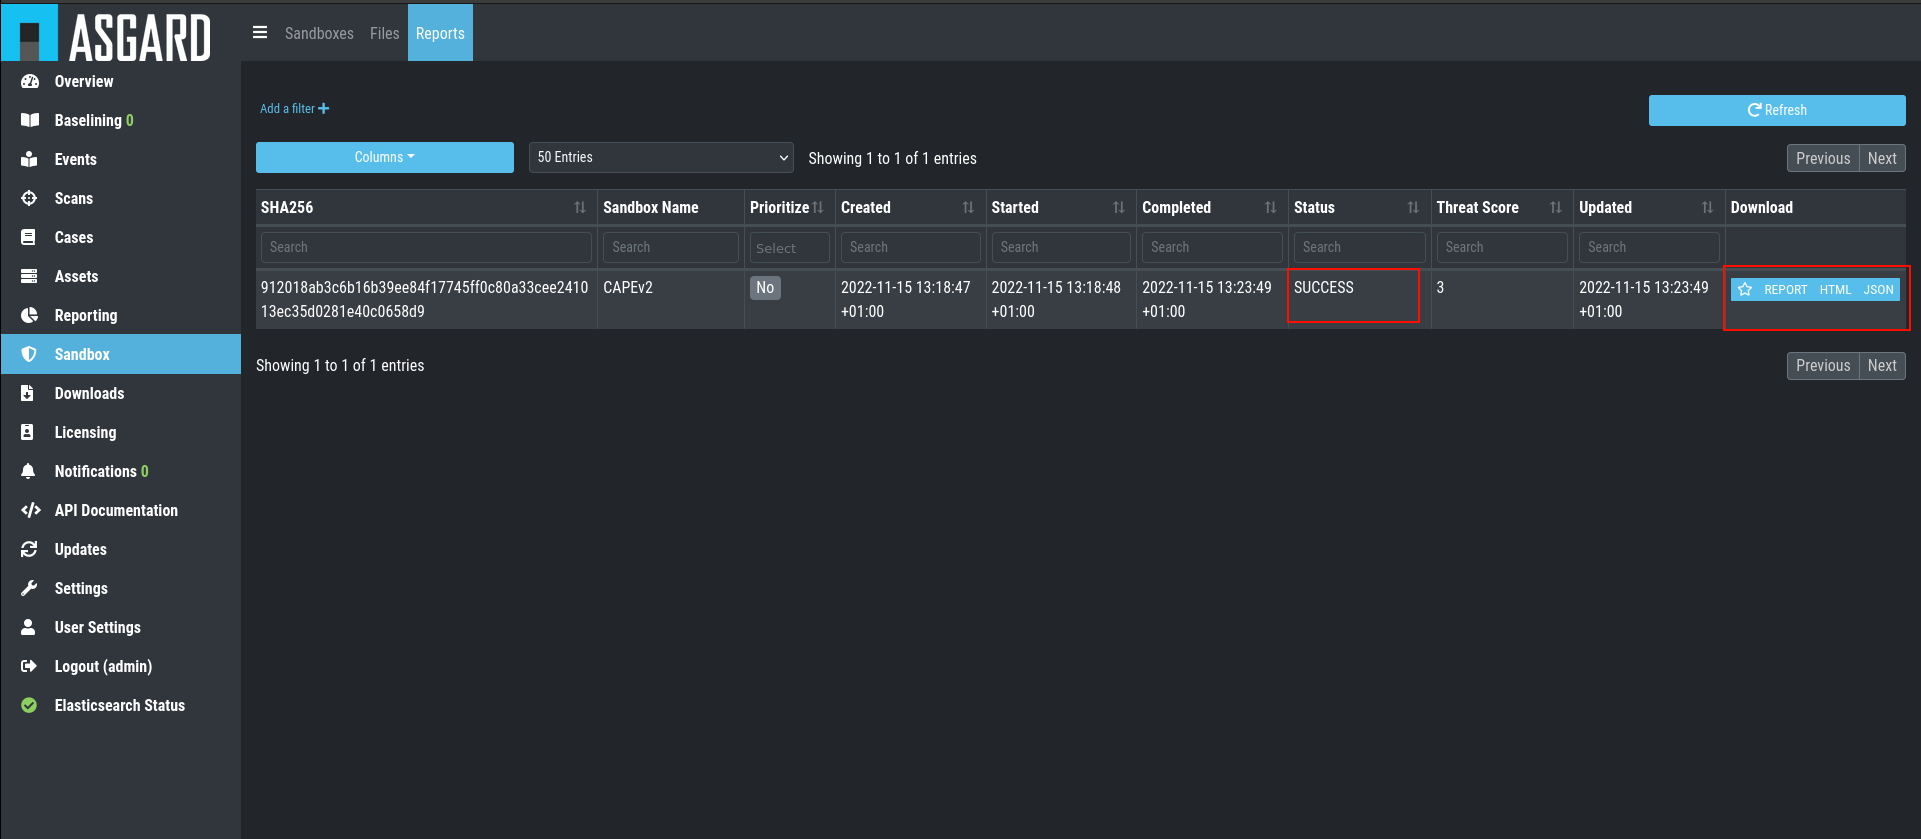
You can now download the report.
4.13. API
The API documentation has been integrated into the web interface.
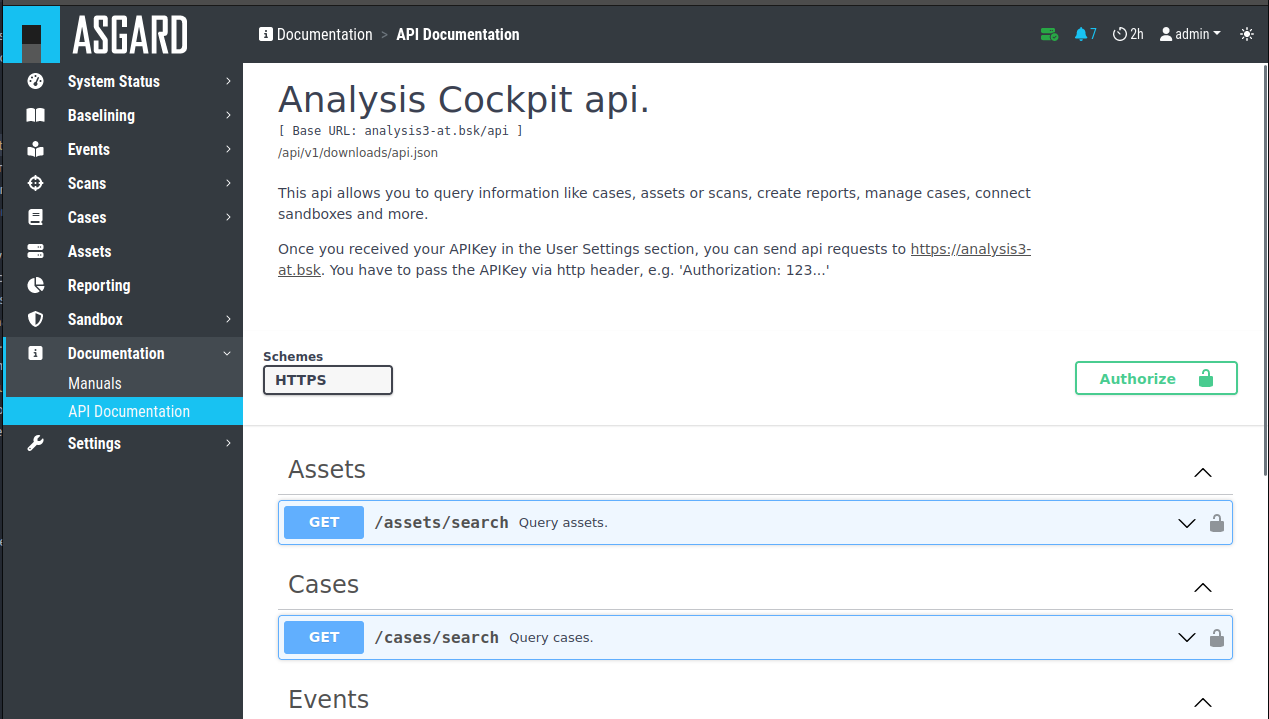
API Documentation