3.1. Link ASGARD Management Center
>Settings\Connected Systems\Management Center
In order to receive log data from your ASGARD Management Center(s), add them in the corresponding section in the system settings:
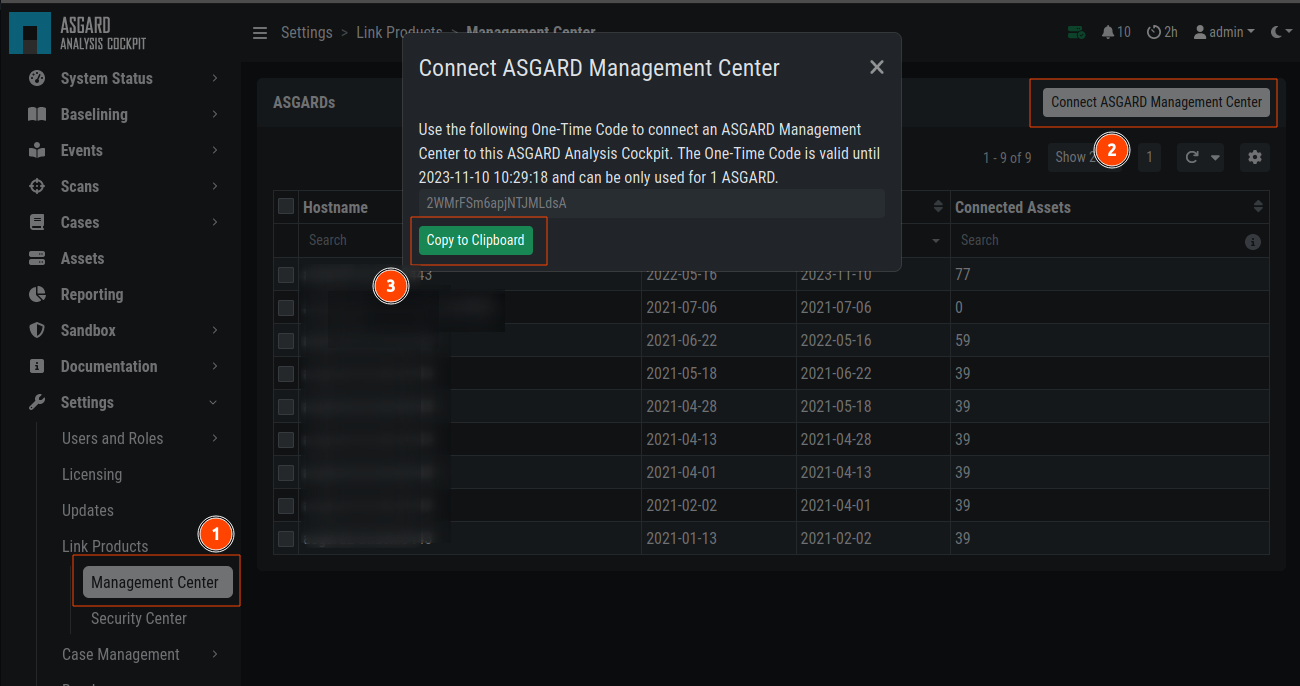
Link ASGARD Management Center
After you have connected the two components, all assets along with additional
information from ASGARD will show up in the Assets section of your Analysis
Cockpit.
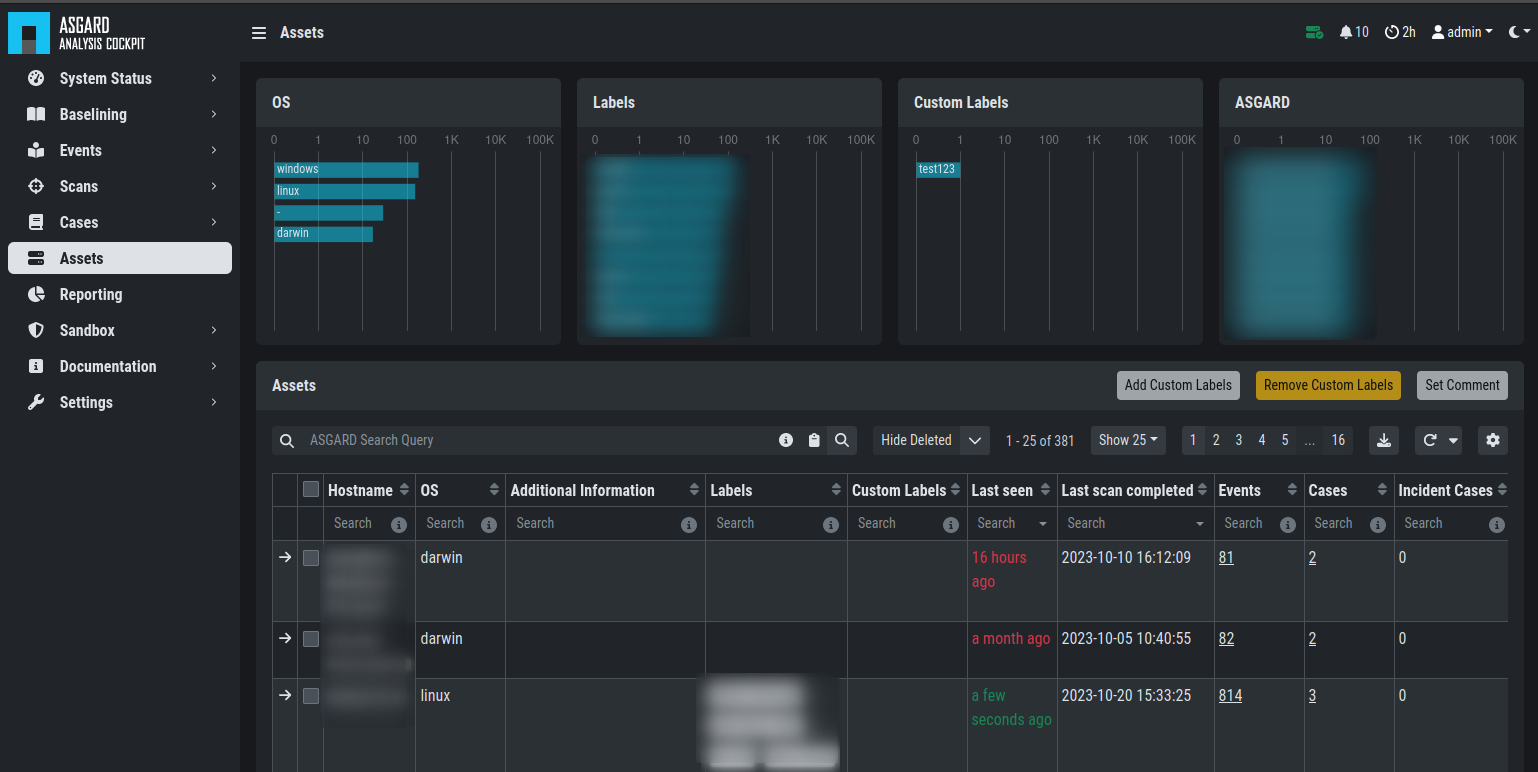
Asset View after a Successful Connection
3.2. Asset View
>Assets
In most cases working with the Baselining section and the Cases section
can be seen as the best practice approach for setting baselines and
dealing with alerts and warnings.
However, in some cases it makes sense to change perspective and rather go for a host centric approach. The Analysis Cockpit will calculate numbers of lines in different case types (Incident, Suspicious, Anomaly, etc.) on a per host basis for a given time frame. Information from the ASGARD, such as last scan dates, labels, host availability, and many more can allow for an entirely different perspective.
By using the "Asset View" you can easily answer questions like:
Which systems appear most often in Incident cases?
Which systems haven't reported a single event for more than a month?
Which Domain Controllers have not been scanned yet?
Which systems in the subnet "192.168.0.0/16" appear in Incident cases?
You can also set a time when an asset was compromised. This is useful when you want to see which systems were compromised in the last 30 days.
In combination with the ASGARD Query and Labels, which are pinned to your assets,
you can even narrow down the events by system group
(e.g., Domain Controllers, or certain locations).

Filtering within the Assets view
For more ASGARD Query examples, please open the Query Help on the right of the query input field (info icon).